binary128
Dormant account
- Joined
- May 18, 2009
- Location
- Vancouver, BC
Jufo,
First of all, I can't thank you enough for all of the work that you have done here.
You're right - If I had done this work through my DB samples analysis, well ... I'd still be doing this work.
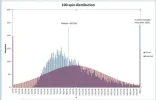
Personally, I find this most recent distribution chart, the one with the 10,000 samples, each sample representing 10,000 rounds, to be the most informative.
I've spent a lot of time in an assortment of wiki files, trying hard to get a handle on all of this. I realized that I have never, to my knowledge anyway, worked with non-normal data, at least not to the extent which your work has uncovered. To me, SD has always been a plus or minus around some mean.
This second distribution chart made the actual distribution visually obvious. The actual mean may equal the expected mean, but their modes are completely different. The skewness is also a significant issue, with the right hand tail being the most significant.
My goal in all of this was to create a page which provides "workable data" to the Player, something of value for the Player. However, as both you and I have stated, and wrestled with, repeatedly throughout this thread, the information (both data and words) has to be technically accurate.
I've read and re-read and re-read your recent posts, spent time wandering through an assortment of wiki files, thought and puzzled and re-thought ...
I've concluded that, right now anyway, I do not know how to present the words for the SD data in a manner that is both understandable and accurate.
I still think that it is in there somewhere. Maybe I can find, use or have one of our people create a Flash chart that will present a curve for any selected slot. I use something like this on our current Certified Fair Gambling page, but this chart is just a simple run chart. What we're talking about here is something significantly different, significantly more complicated.
What I've done - I've simply removed Standard Deviation from the Definition of Terms section. Both of the remaining bits (Variance and Line Pay Hit Frequency) are OK.
Again, Jufo, thank you very much for all of this work. With these SD words removed from the file, I believe the file can now be deployed.
I've gained a great deal of understanding about the statistics of slots. So, for me anyway, this journey has been of tremendous value.
Chris


 )
)